Data Analysis Winter...
In addition to pimping the boat this winter we have been doing a lot of analysis of all the data that we collected during our 2010 racing season. In doing so we have learned a lot of lessons about what it takes to seriously collect data and analyze it - some of these include:

- Manage events & sail selections during the race before you forget
- Weigh everything going on the boat (crew, sails, gear & stores)
- Make sure all systems are working correctly
In our data analysis we are taking two different approaches with the hope of converging them - the first involves a brute force statistical analysis of all our data and uses statistical techniques to determine optimal sailing angles, sail selections and the like. The second approach involves picking phases within races where there is minimal wind sheer and not much current.
Thus far we have completed our brute force statistical analysis and created an updated set of Polar Tables & Sail Selection Charts based on a VPP done by Paul Beiker (Beiker Boats) and Chris Williams (North Sails). This indicated a number of issues with our previous sailing angles which we are now testing using our phased analysis -- the end result will likely be a very carefully done polar table and sail selection chart that is matched to our sail inventory and current state of boat preparation.
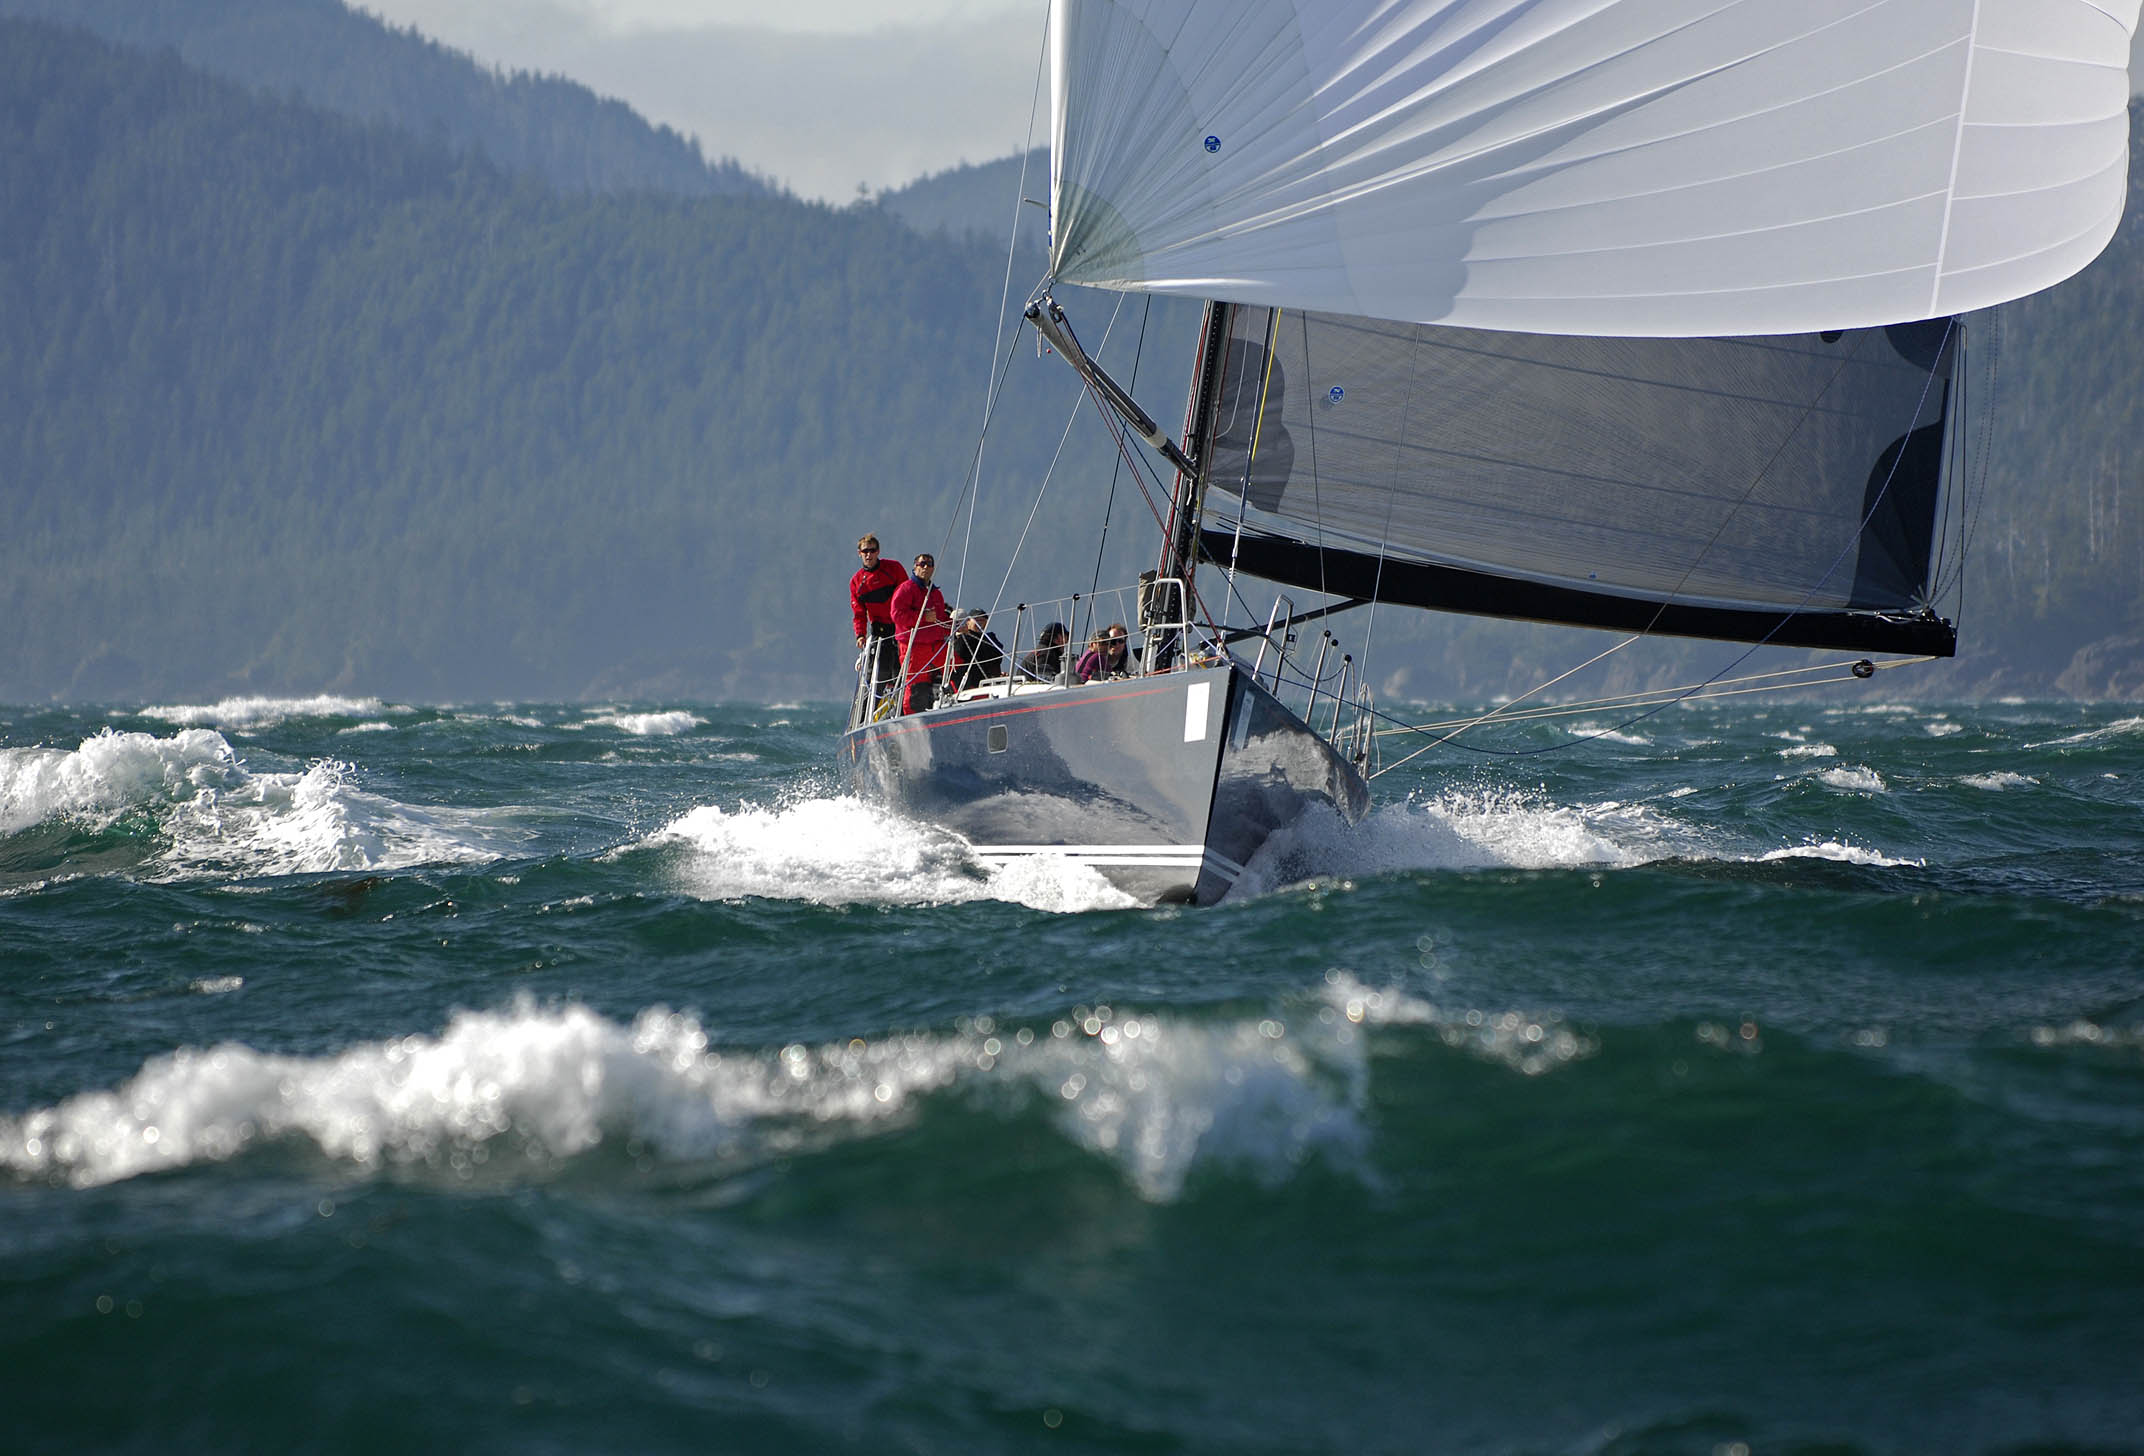
One particularly interesting segment of our analysis comes from the aborted 2010 Southern Straits race - this picture illustrates our analysis where we are doing approximately 22 knots VMG (the actual boat speed is much higher) in 46 knots TWS at a TWA of about 170 -- pretty interesting numbers that thankfully we don't get to experience very much!

<< Home